Revenue and Demand
The demand curve is a tremendously useful illustration for those who can read it. We have seen that the downward slope tells us that there is an inverse relationship between price and quantity. One can also view the demand curve as separating a region in which sellers can operate from a region forbidden to them. But there is more, especially when one considers what an area on the graph represents.
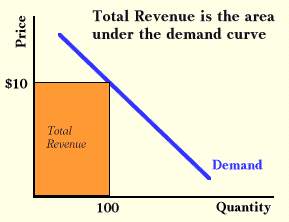
If people will buy 100 units of a product when its price is $10.00, as the picture below illustrates, total revenue for sellers will be $1000. Simple geometry tells us that the area of the rectangle formed under the demand curve in the picture is found by multiplying the height of the rectangle by its width. Because the height is price and the width is quantity, and since price multiplied by quantity is total revenue, the area is total revenue. The fact that area on supply and demand graphs measures total revenue (or total expenditure by buyers, which is the same thing from another viewpoint) is a key idea used repeatedly in microeconomics.

From the demand curve, we can obtain total revenue. From total revenue, we can obtain another key concept: marginal revenue. Marginal revenue is the additional revenue added by an additional unit of output, or in terms of a formula:
Marginal Revenue = (Change in total revenue) divided by (Change in sales)
According to the picture, people will not buy more than 100 units at a price of $10.00. To sell more, price must drop. Suppose that to sell the 101st unit, the price must drop to $9.95. What will the marginal revenue of the 101st unit be? Or, in other words, by how much will total revenue increase when the 101st unit is sold?
There is a temptation to answer this question by replying, "$9.95." A little arithmetic shows that this answer is incorrect. Total revenue when 100 are sold is $1000. When 101 are sold, total revenue is (101) x ($9.95) = $1004.95. The marginal revenue of the 101st unit is only $4.95.
To see why the marginal revenue is less than price, one must understand the importance of the downward-sloping demand curve. To sell another unit, sellers must lower price on all units. They received an extra $9.95 for the 101st unit, but they lost $.05 on the 100 that they were previously selling. So the net increase in revenue was the $9.95 minus the $5.00, or $4.95.
There is a another way to see why marginal revenue will be less than price when a demand curve slopes downward. Price is average revenue. If the firm sells 100 for $10.00, the average revenue for each unit is $10.00. But as sellers sell more, the average revenue (or price) drops, and this can only happen if the marginal revenue is below price, pulling the average down.
The reasoning of why marginal will be below average if average is dropping can perhaps be better seen in another example. Suppose that the average age of 20 people in a room is 25 years, and that another person enters the room. If the average age of the people rises as a result, the extra person must be older than 25. If the average age drops, the extra person must be younger than 25. If the added person is exactly 25, then the average age will not change. Whenever an average is rising, its marginal must be above the average, and whenever an average is falling, its marginal must be below the average.
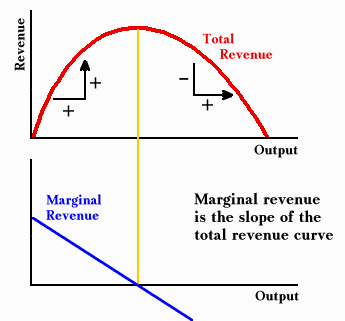
If one knows marginal revenue, one can tell what happens to total revenue if sales change. If selling another unit increases total revenue, the marginal revenue must be greater than zero. If marginal revenue is less than zero, then selling another unit takes away from total revenue. If marginal revenue is zero, than selling another does not change total revenue. This relationship exists because marginal revenue measures the slope of the total revenue curve.

The picture above illustrates the relationship between total revenue and marginal revenue. The total revenue curve will be zero when nothing is sold and zero again when a great deal is sold at a zero price. Thus, it has the shape of an inverted U. The slope of any curve is defined as the rise over the run. The rise for the total revenue curve is the change in total revenue, and the run is the change in output. Therefore,
Slope of Total Revenue Curve = (Change in total revenue) / (Change in amount sold)
But this definition of slope is identical to the definition of marginal revenue, which demonstrates that marginal revenue is the slope of the total revenue curve.